Traditionally, it’s time for a ‘Santa rally’ in the markets, but will we see one this year?
- Richard Harris says while history offers ample evidence that stock prices often defy predictions, there’s an observable seasonality to markets. It pays to follow the flow – until and unless an earthquake hits
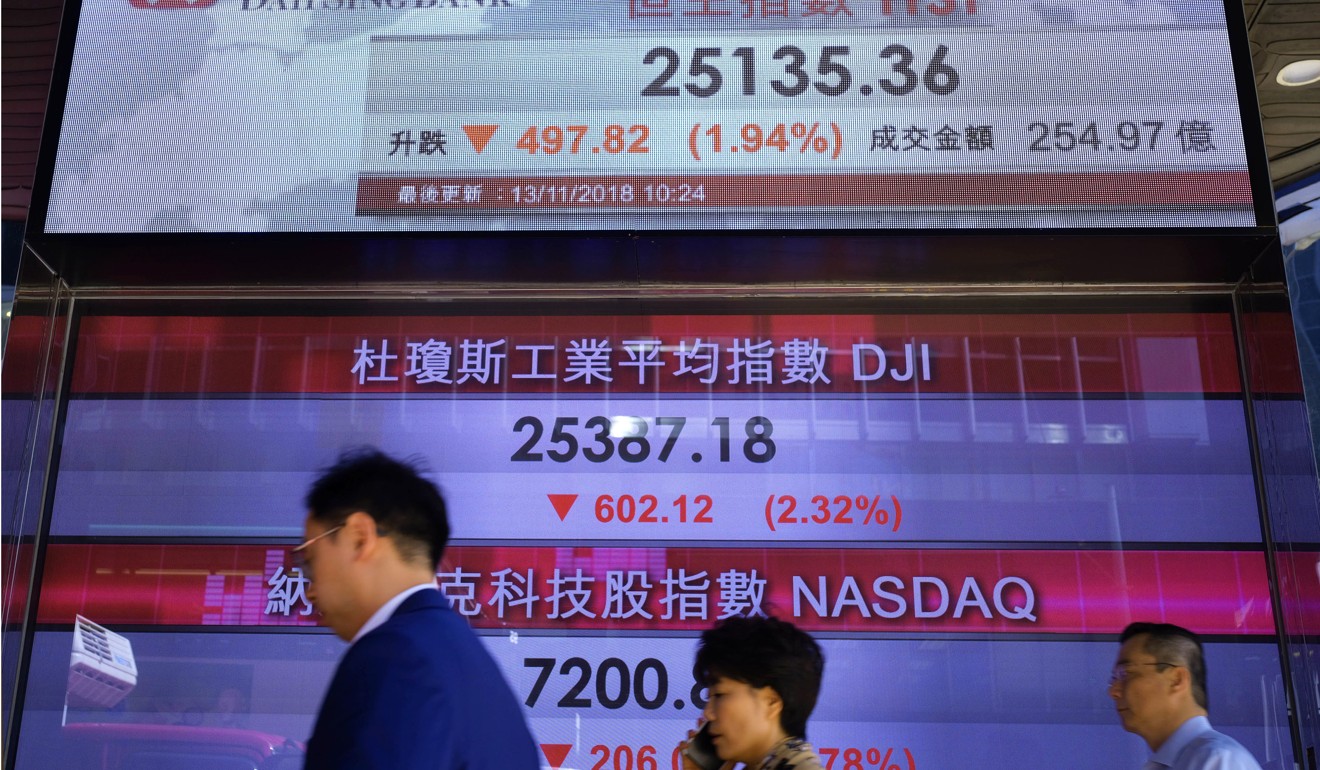
To put this into perspective, the crash of October 28, 1929, saw the stock market fall 38.3 points, or 13 per cent, to 260.6. The Dow is now at around 25,000 points – that’s why you should stay in the market.
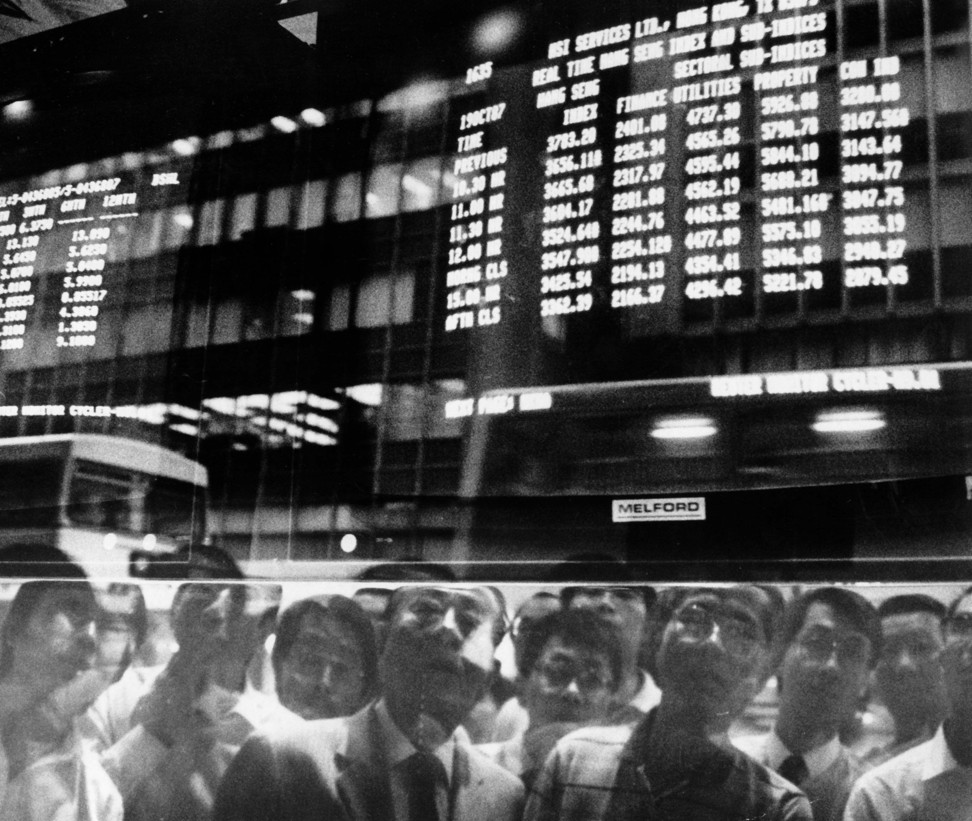
I was trading during the collapse in October 1987. People panicked as their wealth evaporated in a way unseen since the Great Depression. Misfortune comes in threes – the falls combined with a public holiday and one of the worst storms ever to hit the City of London.

Using a measure of volatility beloved by risk planners, it was the worst day in stock market history. The market fell by 19 standard deviations, which is frankly statistically impossible. Most risk planners use forms of normal distributions, or bell curves, to calculate risk. It works almost all the time; until it doesn’t, which is when you actually need it. To paraphrase John Maynard Keynes, “the market can stay irrational longer than you can stay solvent”. It is like an earthquake moving along a fault line, which creates devastation even though the ground on both sides of the fault remains unaltered.
Prices have a propensity to do predictably unusual things while showing an observable commonality or seasonality. We might ask, for example: “Tell me why the US stock market doesn’t like Mondays?” Perhaps because investors have to go back to work. Tuesday is the second best day in the week for bulls. Traders have known this for years, but it still doesn’t arbitrage away.
This year, Thursdays have been the worst day of the week, especially during periods of stress. Fridays have been the best day of the week, as traders flatten their books ahead of the weekend. If poor sentiment hits on Friday, traders fret over the weekend and sell hard on Monday – setting up a difficult week.

Wall Street returns over the past 40 years have typically seen a strong January, a weak February, good investor months in March and April and tailing off in May (when, as the adage goes, it’s time to go away). Summers are generally dull, with a weak September. The last quarter of the year is the best, as October (despite its reputation as a black month) is up on average; November is the second best month of the year, and December the best.
These mantras usually work, and are occasionally spectacularly wrong if an earthquake hits the market. Nevertheless, investors also observe the quarterly effect, the Thanksgiving affect, the Lunar New Year effect, and the Halloween effect.
The Santa rally may not be spectacular, but it should be enough to warrant holding equity markets
But surviving such bad news puts into play the November/December effect – the Santa rally. It may not be spectacular. It may not be worth trading; but it should be enough to warrant holding equity markets, recoup some of 2018’s losses, and look over the year-end to see what 2019 brings.
However, we should not forget the wisdom of Warren: “What we learn from history is that people don't learn from history.”
Richard Harris is chief executive of Port Shelter Investment and a veteran investment manager, banker, writer and broadcaster, and financial expert witness

